By Renée Mauborgne & Chan W Kim.
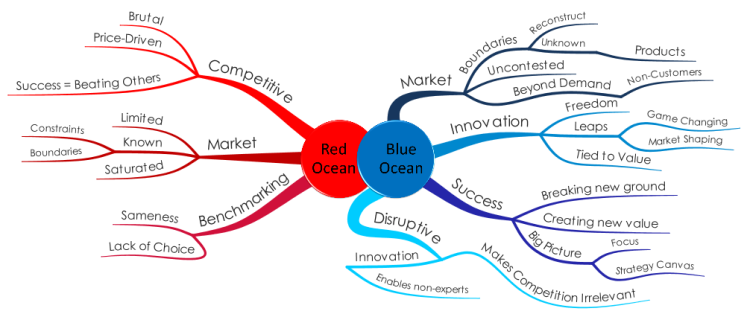
This post summarizes the book Blue Ocean Strategy by Renée Mauborgne & Chan W Kim. It shows the differences between a winning strategy (Blue) versus a competitive one (Red).
PART 1: BLUE OCEAN STRATEGY
1- BLUE OCEAN’S CONCEPT
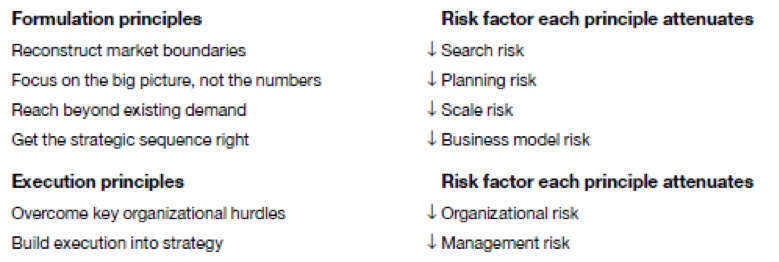
A- The 6 Blue Ocean’s principles
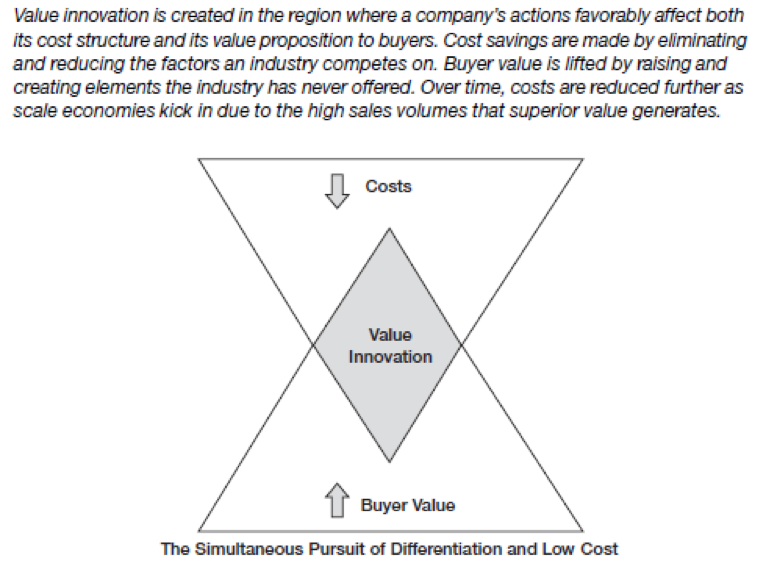
B- Blue Ocean value innovation
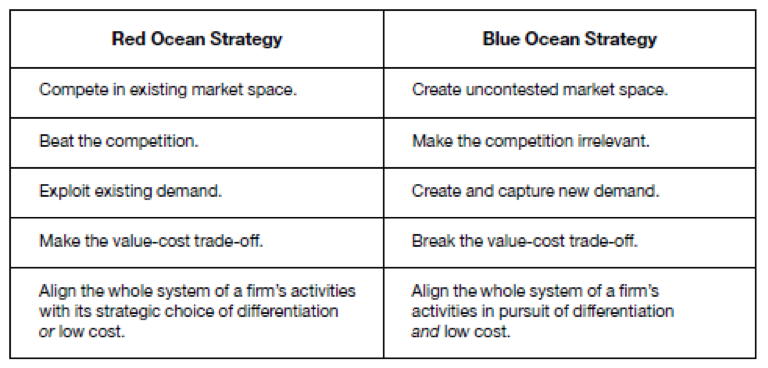
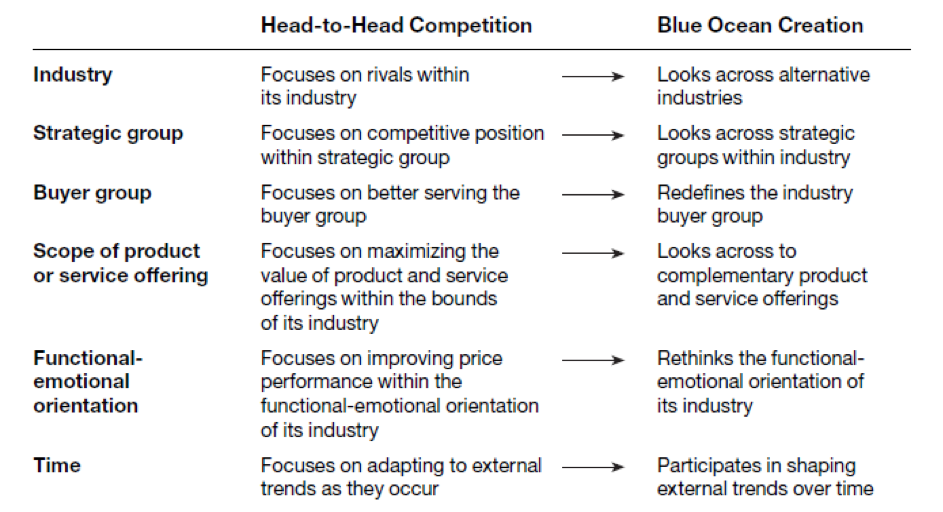
C- Red Ocean VS Blue Ocean strategies
2- TOOLS & FRAMEWORK
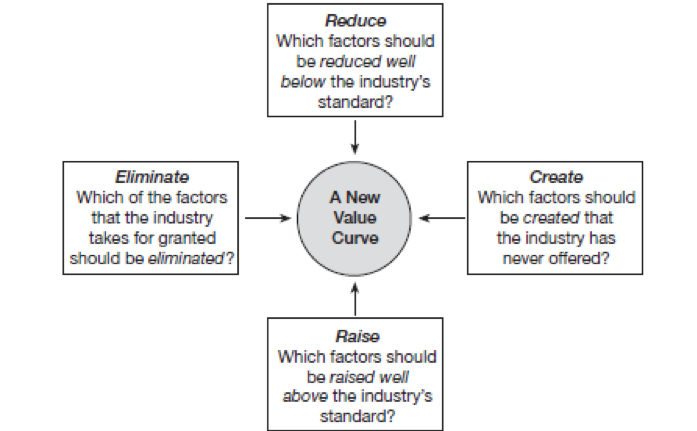
A- The four actions framework
- Which of the factors that the industry takes for granted should be eliminated?
- Which factors should be reducedwell below the industry’s standard?
- Which factors should be raisedwell above the industry’s standard?
- Which factors should be createdthat the industry has never offered?
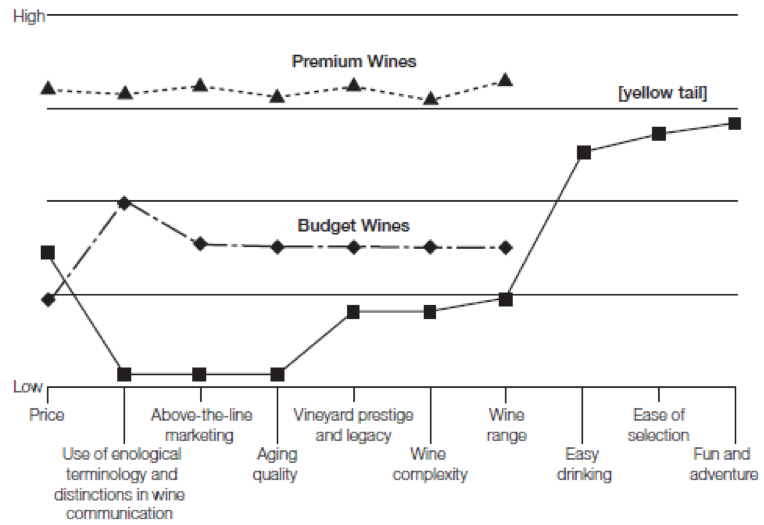
B- Blue ocean strategy Canvas [yellow tail]
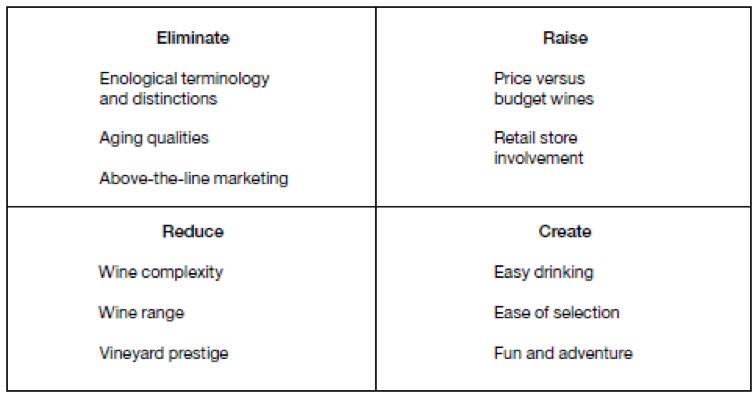
C- The Eliminate-Reduce-Raise-Create Grid
D- The 3 Blue Ocean’s principles
These three characteristics serve as an initial litmus test of the commercial viability of blue ocean ideas.
Focus
Emphasize the main strategic points (easy drinking, ease of selection, fun and adventure).
Divergence
Apply the four actions of eliminating, reducing, raising, and creating to differentiate your profiles from the industry’s average profile.
Compelling Tagline
A good tagline must not only deliver a clear message but also advertise an offering truthfully, or else customers will lose trust and interest. In fact, a good way to test the effectiveness and strength of a strategy is to look at whether it contains a strong and authentic tagline (“The essence of a great land . . . Australia.”).
E- Reading the Value Curves
A Blue Ocean Strategy
Does the Value Curves meets the 3 criteria?When a company’s value curve, or its competitors’, meets the three criteria that define a good blue ocean strategy—focus, divergence, and a compelling tagline that speaks to the market—the company is on the right track.
A Company Caught in the Red Ocean
Does the Value Curves converges with its competitors? If yes, it signals that a company is likely caught within the red ocean of bloody competition. A company’s explicit or implicit strategy tends to be trying to outdo its competition on the basis of cost or quality.
Over delivery Without Payback
Does the company deliver high levels across all factors? So does the company’s market share and profitability reflect these investments?If not, the strategy canvas signals that the company may be oversupplying its customers, offering too much of those elements that add incremental value to buyers. To value-innovate, the company must decide which factors to eliminate and reduce—and not only those to raise and create—to construct a divergent value curve.
An Incoherent Strategy
When a company’s value curve looks like a bowl of spaghetti—a zigzag with no rhyme or reason, where the offering can be described as “low-high-low-low-high-low-high”—it signals that the company doesn’t have a coherent strategy.
Strategic Contradictions
Are there strategic contradictions?These are areas where a company is offering a high level on one competing factor while ignoring others that support that factor. An example is investing heavily in making a company’s Web site easy to use but failing to correct the site’s slow speed of operation.
An Internally Driven Company
In drawing the strategy canvas, how does a company label the industry’s competing factors?For example, does it use the word megahertzinstead of speed, or thermal water temperature instead of hotwater? Are the competing factors stated in terms buyers can understand and value, or are they in operational jargon?
PART 2 : FORMULATING BLUE OCEAN STRATEGY
1- RECONSTRUCT MARKET BOUNDARIES
A- 6 paths framework
Path 1: Look Across Alternative Industries
Example: purchase its own aircraft or commercial airlines flights for business travelers? àNetJets (fractional jet ownership) created a new industry between these two.
Path 2: Look Across Strategic Groups Within Industries
Example: traditional health club (conviviality, external from home) + home exercise program (price, less equipment) -> Curves combined
Path 3: Look Across the Chain of Buyers
Novo Nordisk(insulin producer) went from doctors influencers to final customers directly.
Path 4: Look Across Complementary Product and Service Offerings
Example : in the bus industry the maintenance costs are high + buyers are looking for the best bus price when they decide to buy some àNABIadopted fiberglass in making its buses (less maintenance, lower consumption, lower powered engines etc.).
Path 5: Look Across Functional or Emotional Appeal to Buyers
- Swatch(budget watch industry into an emotionally driven fashion statement).
- QB House(from an emotional industry to a highly functional one).
- Cemex(functional to emotional).
Path 6: Look Across Time
What trends have a high probability of impacting your industry ?
- Applewith iTunes (with illegal downloads it was predictable that a regular industry will emerge).
- Cisco predicted the high volume traffic on internet and so it focused on servers’ development.
2- FOCUS ON THE BIG PICTURE, NOT THE NUMBERS
A- The four steps of visualizing strategy
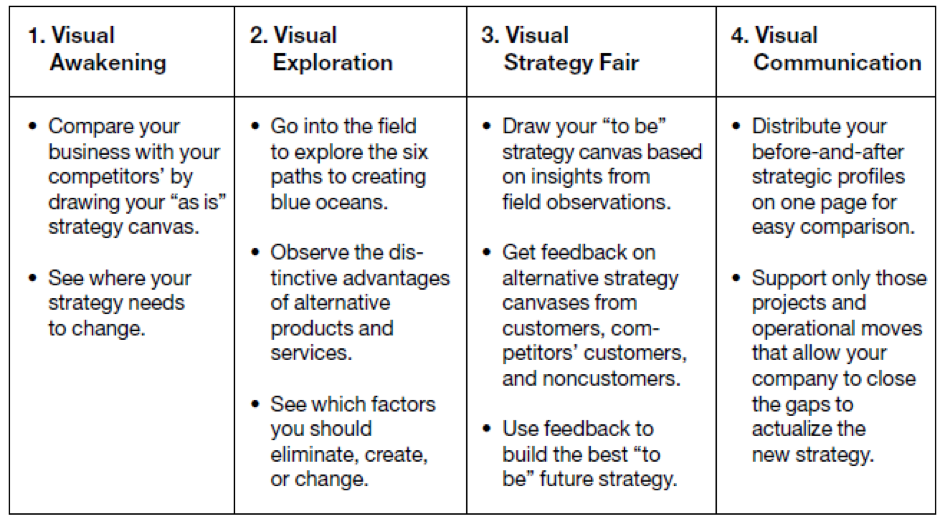
Example: European Financial Services (EFS)
Bloomberg went into the field to discover their customer’s needs (2. Visual Exploration).
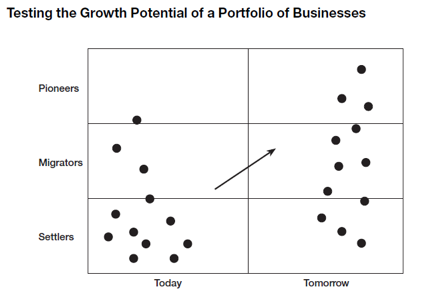
B- Using the Pioneer-Migrator-Settler (PMS) Map
Pioneers: they offer unprecedented value àsources of profitable growth
Settlers: these are me-too businesses àno much future
Migrators: somewhere in between red and blue ocean àoffer improved value, but not innovative value
TI baseband à Settlers, “
3- REACH BEYOND EXISTING DEMAND
Reach beyond existing demand : Golf Callaway’s example with the bigger club than the standard one. Non-client àClient.